
Backpressure and cache adventure with COSMO Backend
I’m working as a Senior Backend Developer Scala/Java for SNCF COSMO project. At train nation scale, COSMO is the new unify device to ease ticket boarding, control, booking, collection and other train services.
Today, COSMO is deployed in beta in 4 train stations: Rennes, Roissy, Lyon and Strasbourg. This adventure/issue starts when we were deploying the solution (device + the backend) at Lyon station.
Someone reported strange variation in the Kafka consuming data from our partner PAO (Portails d’Accès aux Offres). The PAO team offer us a Kafka topic to get real time information on train tickets. We can see the following on the 29th November 2017 and an other variation on the 04th December 2017.
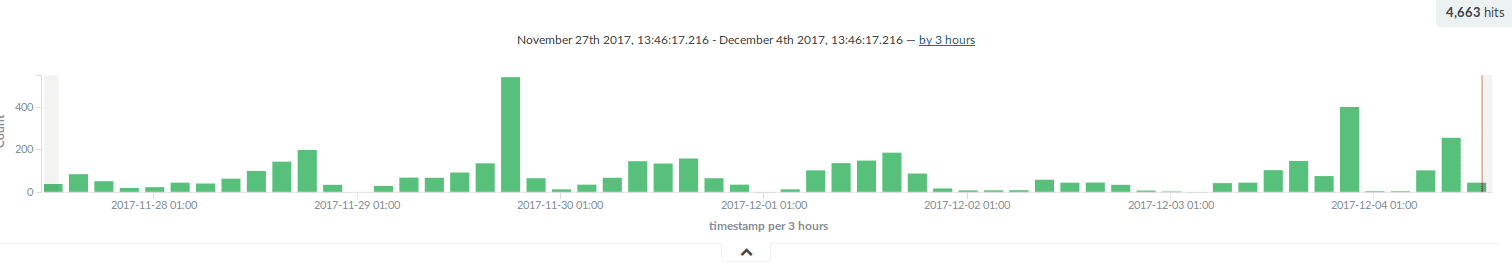
Based on our software architecture, if we have such variations, it could be from PAO real time information Kafka topic. More information is coming, so we have more information ingested in our system. So, I’m asking the PAO team if we could match our backend spike with their backend.
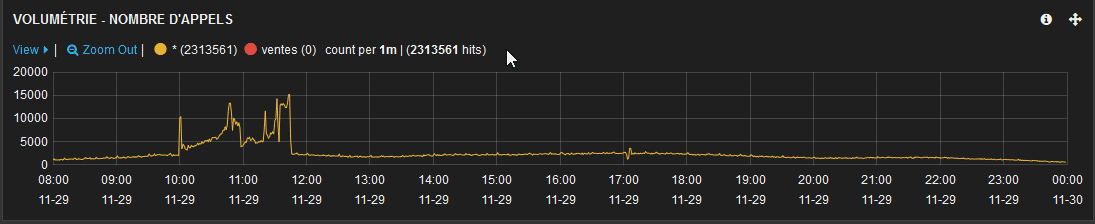
Surprise! From the producer perspective (PAO), there’s no such spike on the dates previously discussed.
Bonjour Nicolas, Voici la courbe d’activité du consommateur COSMO côté PAO et je ne constate aucun pic d’activité entre 19h et 20h. J’ai bien peur que le pb soit côté COSMO pour ce pic d’activité. — Cyrille Piton
What happened ? :(
On COSMO Backend Houston, we are using Akka-Streams. Within our design, this framework allows us to use the backpressure functionnality with our data processing. The notion of backpressure is well described in the Reactive Streams specification
So the first thing as the Scala/Java developer we look at is the jvm heap!
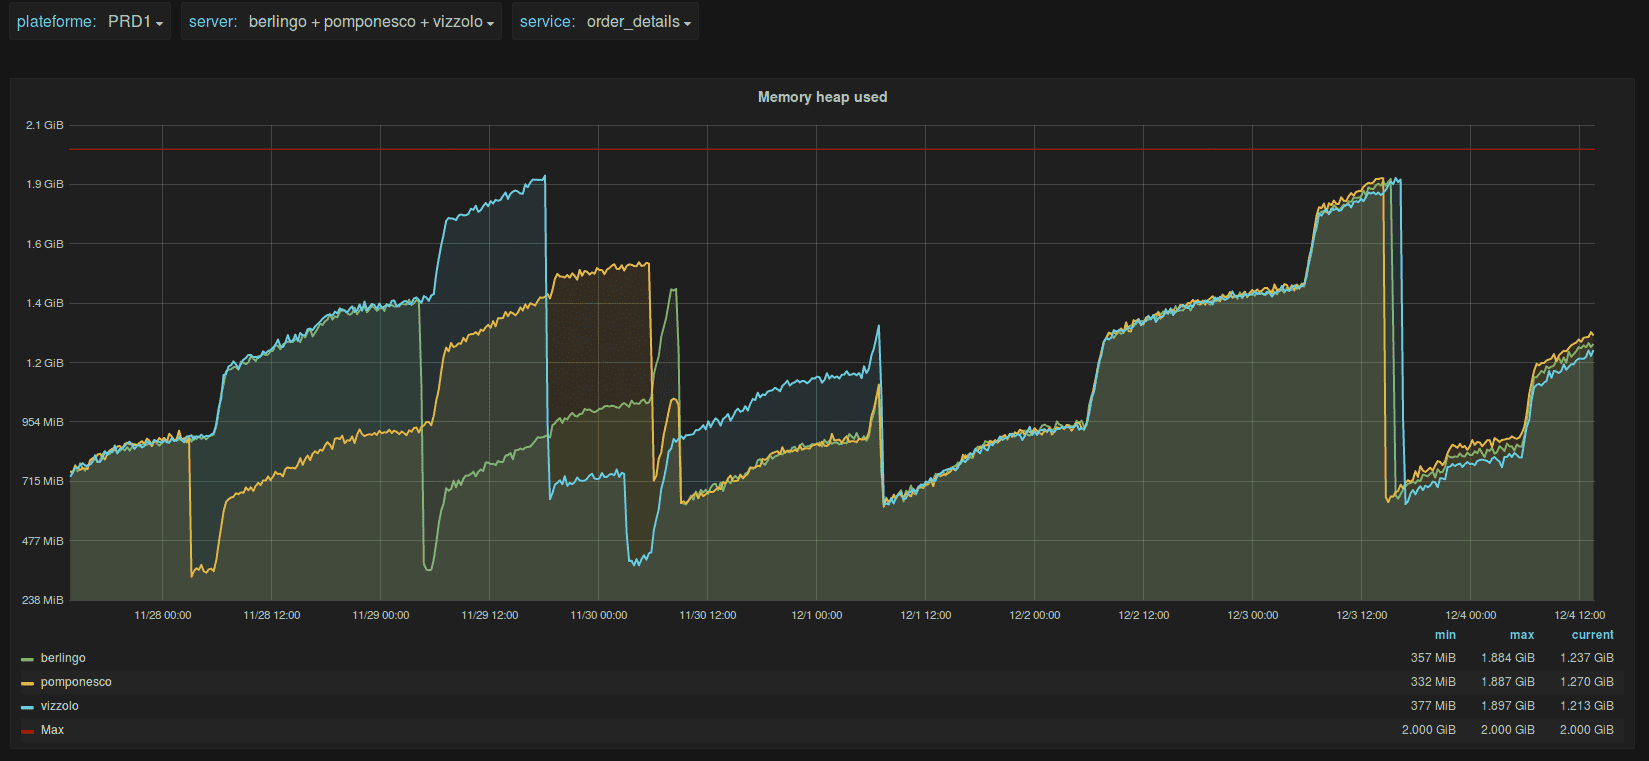
On the 2 dates previously mentionned, we can see that the java heap is high around 2 Gb allocated. What’s consuming in our java heap backend? Looking closely, we could see that these instances of our backend contained a local embedded cache.
This embedded cache is really high in number of entries at thoses particular dates. Another clue, the CPU.
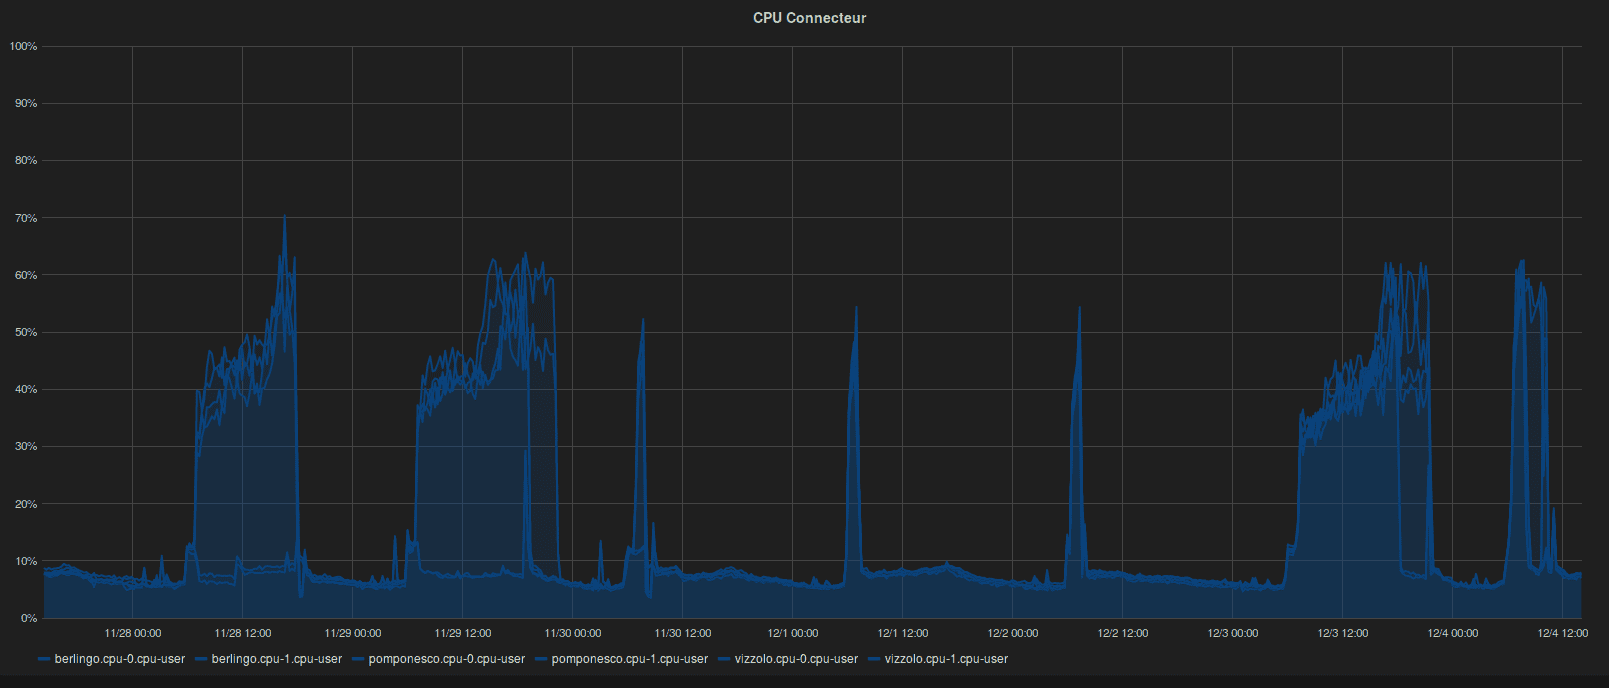
We could see the same type of spike variation on the CPU at the same time.
The conclusion
The embedded cache we used on our real time information Kafka consumer eats all the available java heap memory. The memory for processing the data in the application were fighting for ressources. And it loses the fight for memory, so Akka-stream backpressure since the application doesn’t have enough memory to process the data fast enough. This doesn’t break our application but it just asking the consumer to consume slower since the resources become scarce. Another effect, since the heap is running low, the Java Garbage Collector is running frequently in quest for memory hence we see the spike in CPU.
As soon as the cache “release” the memory due to the entries ttl and the Java Garbage Collector could reclaim some memory, the backpressure allow some more elements to be consumed to integrate real time information. That’s why we could see the first spike beforehand!
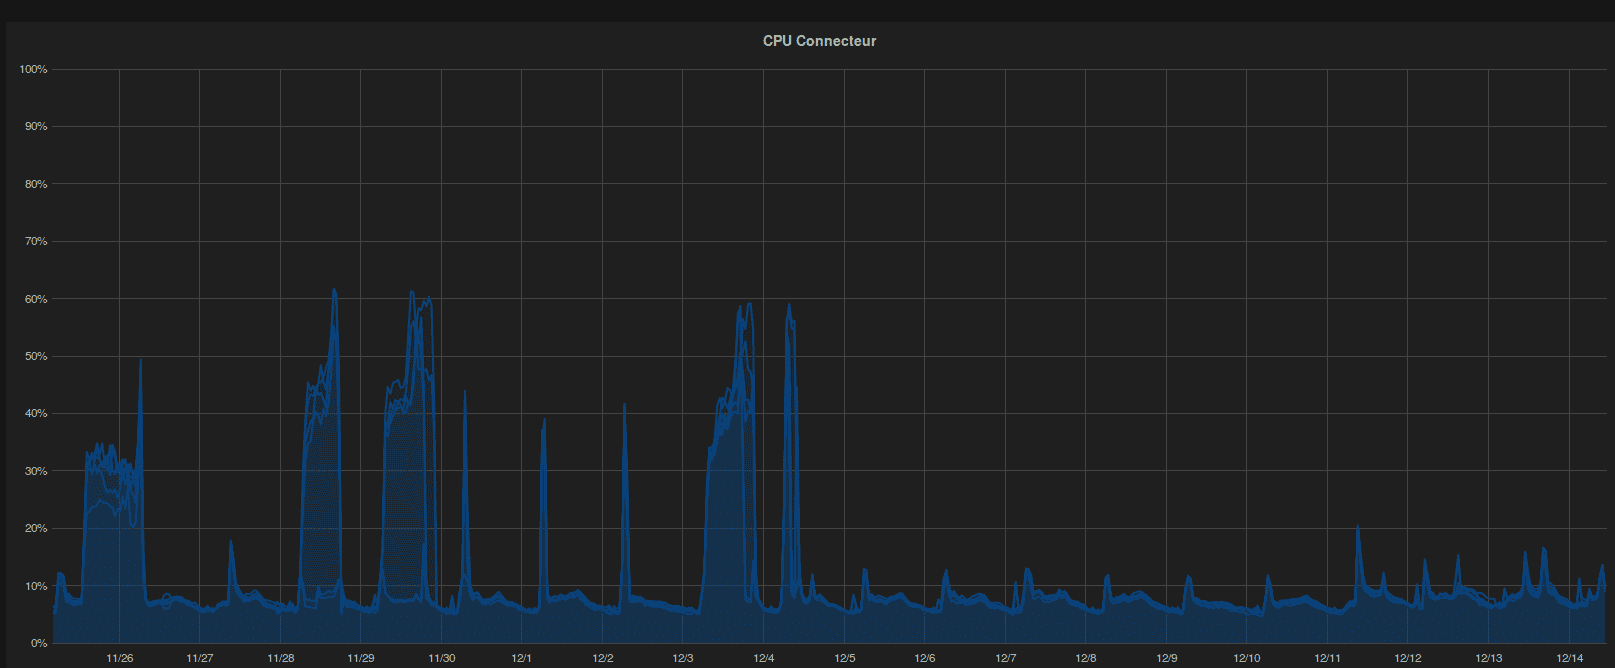
A first action has been done with our Ops Engineer Clément Villeret, we limit the embedded cache instance properly to keep it from taking all the JVM heap memory. Here’s the CPU monitoring after this change.
Before
After
After confirming that, we investigate with Clément the optimal parameter for the embedded cache and JVM Heap sizing to fit the amount of data in our data processing.